


To use weather GRIB files for storm avoidance, you need to understand their grid-based data structure, which holds meteorological info like wind speed and pressure across specific locations. By applying interpolation techniques, you can estimate weather conditions between grid points for more precise maps. This helps you visualize storm movement, turbulence, and gusts effectively. If you keep exploring, you’ll discover how to harness this data for safer navigation and real-time weather decisions.
Key Takeaways
- Understand the structure of GRIB files, including grid points, parameters, and geographic coordinates, for effective data extraction.
- Use specialized tools or libraries (e.g., wgrib2, pygrib) to read and interpret weather data from GRIB files.
- Apply interpolation techniques like bilinear or bicubic to estimate weather conditions between grid points for detailed analysis.
- Visualize interpolated data to identify storm patterns, wind speeds, and turbulence, aiding in real-time storm avoidance decisions.
- Combine GRIB data insights with navigation strategies to enhance safety and optimize routes during severe weather conditions.
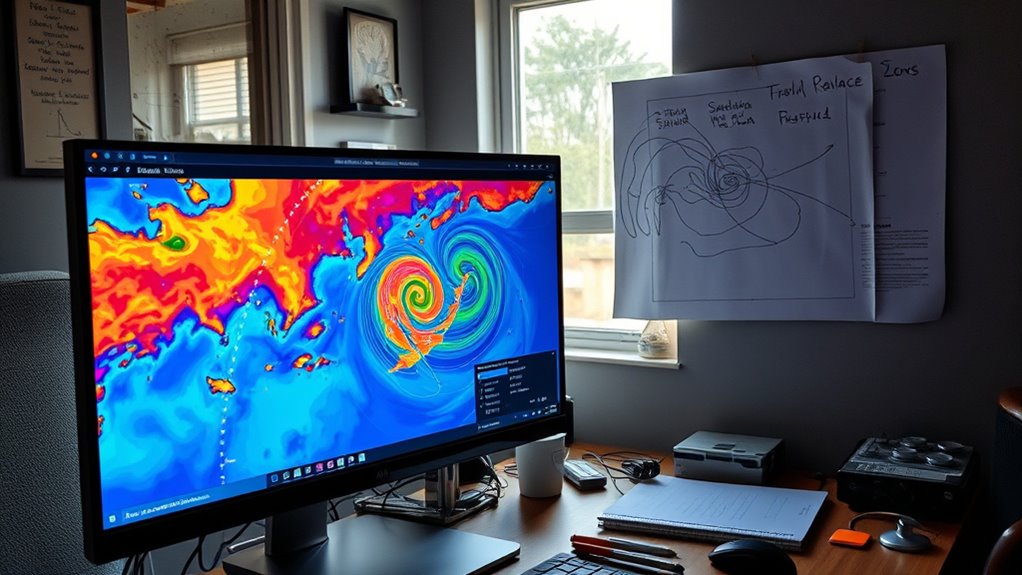
Have you ever wondered how to efficiently extract and interpret weather data from GRIB files? If you’re involved in storm avoidance, understanding how to handle this data is essential. GRIB files store complex weather information, including wind speeds, pressure, temperature, and precipitation, all organized in a structured format that can seem overwhelming at first glance. The key to making this data useful lies in working with grid data and applying data interpolation techniques. Grid data refers to the organized representation of weather variables across a set of geographic points, forming a grid that covers the area you’re interested in. Each point on this grid holds specific meteorological information, but since weather conditions can change rapidly and data points are discrete, you often need to estimate values between these points to get a continuous picture. That’s where data interpolation comes into play, helping you generate smoother, more accurate representations of weather conditions across your area of concern. Additionally, understanding the contrast ratio of the data helps you interpret the difference between various weather conditions more clearly. To start, you need to understand the structure of the grid data within the GRIB files. These files typically contain multiple layers, each representing different weather parameters, with information about their geographic coordinates and levels. Once you access the data, you’ll notice that each grid point has a set of values corresponding to specific locations. However, because weather phenomena don’t adhere to grid points perfectly, you have to interpolate data to fill in gaps and create a more detailed weather map. Interpolation methods, such as bilinear or bicubic interpolation, analyze the surrounding grid points to estimate the weather variable at any given location. This process ensures you can visualize weather patterns with higher resolution, which is critical when you’re trying to avoid storms. Using data interpolation allows you to generate detailed, localized weather forecasts from discrete grid data, enabling more precise decision-making. For example, if you’re navigating through storm-prone areas, interpolating wind speed data can reveal potential gusts or turbulence that aren’t directly captured at grid points. The smoother the interpolated data, the better your understanding of how weather conditions evolve across the region. Many weather tools and software packages automate this process, making it easier for you to analyze high-resolution weather models quickly. By mastering how to interpret grid data and perform data interpolation, you’ll improve your ability to anticipate storm movements, plan safer routes, and respond effectively to changing weather conditions. This skill becomes especially valuable when real-time data updates are vital, and precise weather insights can mean the difference between safe navigation and dangerous encounters.

Westinghouse 12500 Watt Dual Fuel Home Backup Portable Generator, Remote Electric Start, Transfer Switch Ready, Gas and Propane Powered
9500 Running Watts and 12500 Peak Watts (Gasoline); 8500 Running Watts, 11200 Peak Watts (Propane); Remote Start with...
As an affiliate, we earn on qualifying purchases.
Frequently Asked Questions
How Often Are GRIB Files Updated During Storm Events?
During storm events, GRIB files are typically updated every 1 to 6 hours, depending on the source and forecast model. You should regularly check these updates, as satellite imagery and forecast models provide fresh data essential for storm tracking and avoidance. Staying current with these updates helps you make informed decisions, especially when weather conditions change rapidly. Always make sure you’re accessing the latest GRIB files for the most accurate information.
Can GRIB Files Be Used for Real-Time Storm Tracking?
You can definitely use GRIB files for real-time storm tracking, but they work best when combined with satellite imagery. These files provide forecast data that, if updated frequently, enhance forecast accuracy. By analyzing GRIB data alongside satellite images, you get a clearer picture of storm movement and intensity, helping you make better decisions quickly. Just keep in mind that timely updates are essential for reliable, real-time tracking.
What Are the Best Tools for Visualizing GRIB Weather Data?
Imagine seeing storms clearly, understanding their paths, and making quick decisions. You can do this with the best tools for visualizing GRIB weather data, like integrated platforms that combine satellite imagery and forecast modeling. These tools offer dynamic maps, layered data, and real-time updates, empowering you to track weather patterns accurately. They turn complex data into actionable insights, helping you stay safe and informed during storm events.
How Do I Interpret Wind Speed and Direction in GRIB Files?
You interpret wind speed and direction in GRIB files by examining wind vectors, which show both magnitude and flow direction. The length of the vectors indicates wind speed, while their orientation reveals the wind’s direction. For storm forecasting, focus on areas with strong, consistent vectors pointing toward storm zones. Understanding these patterns helps you anticipate storm movement and make informed decisions to avoid dangerous weather conditions effectively.
Are There Any Limitations to Using GRIB Data for Storm Avoidance?
A stitch in time saves nine, but relying solely on GRIB data has its limits. While GRIB files provide valuable insights, their data accuracy can vary, and data resolution may not capture rapidly changing storm conditions. These limitations mean you shouldn’t depend entirely on them for storm avoidance. Always cross-check with real-time observations and forecasts to make sure you’re making well-informed decisions, keeping safety your top priority.
300W Portable Power Station, Solar Generator 259Wh, 70,000mAh LiFePO4 Battery with 65W USB-C PD&Pure Sine Wave AC, Solar Charging for Camping,Home Backup,Emergency Power(SOS Light & LCD Display)
【High Capacity and Versatile Power】 The EM300 Solar Power Station delivers 300W pure sine wave output (600watt peak)...
As an affiliate, we earn on qualifying purchases.
Conclusion
So, after all that effort decoding weather GRIB files, you’d think you’d master storm avoidance. Yet, with nature’s unpredictable whims, your carefully analyzed data might still surprise you. Ironically, the very tools designed to keep you safe remind us how little control we truly have. Next time, remember: no matter how sophisticated your readings, Mother Nature’s surprises still hold the final say. Stay vigilant — and maybe keep a weather app handy just in case.
MARBERO Portable Power Station 88Wh Camping Lithium Battery Solar Generator Fast Charging with AC Outlet 120W Peak Power Bank(Solar Panel Optional) for Home Backup Outdoor Emergency RV Van Hunting
EFFICIENT CHARGING: Use the adapter included in the package to charge the power station from 0 to 80%...
As an affiliate, we earn on qualifying purchases.

Portable Power Station with AC Outlet Power Bank for Camping Essentials Small Electric Mini Generator Large Lithium Battery Plug in Output 60W Type-C Laptop Home Backup Outdoor Emergency 99.9Wh, Black
【99.9Wh High-Capacity Battery】With an impressive 99.9Wh battery capacity, our Tenlike portable power station ensures that you can keep...
As an affiliate, we earn on qualifying purchases.